Exploring Marvel's Universe of Characters
An Exploratory Data Analysis of the Marvel Comic Character API.
Introduction
The Marvel API provides insights into the Marvel Comic Universe and its characters. The data contains answers to several questions I found when looking at the API general information. My previous post Marvel EDA Intro discussed in more detail my motivation behind the questions I developed and why I chose this dataset. To paraphrase, I grew up enjoying Marvel movies and was curious how the comics would affect movie production. I was also curious about popular characters and how popular they have been in comics over time. The questions I formed were as follows:
- What are the trends in character popularity within the Marvel Universe, and how have these trends evolved over time?
- What insights can be gained regarding the changing popularity with different characters and events within the Marvel Universe?
- Who is the most popular character and how has that popularity changed over time?
- How does the Marvel Cinematic Universe affect character popularity in comics?
The rest of this post delves into my findings from my exploratory data analysis (EDA). Before getting into my insights from my EDA, here is a link to my GitHub repository with the data and .ipynb file with the code I wrote.
Findings
To answer my questions, I cleaned and manipulated the data from the Marvel API. I made three dataframes using the Pandas library, one with the uncleaned data, one with the cleaned data, and one with extracted data for time analysis. I used the latter two dataframes in my EDA. The cleaned dataframe gave rows of character names, values for comic, story, and event mentions, and lists of the comics, stories, and events where the character is mentioned. The manipulated data extracted years from the comics list, creating the new dataframe with character names, the years, and values for mentions in each year.
The visualizations I made helped to answer my questions more clearly. The first ones I made were bar graphs from the cleaned dataset with the Seaborn and Matplotlib libraries. I wanted insights into how frequently the original Avengers Characters were mentioned throughout comics, and I wanted the same for the top 10 most popular characters.
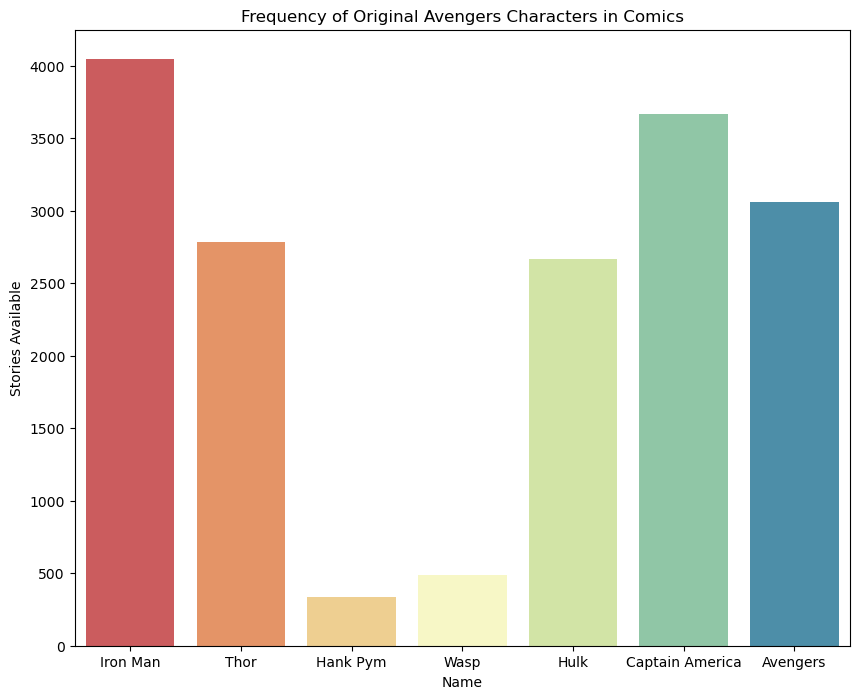
For my Avengers visualizations, the most popular character mentions were for Iron Man and Captain America. That wasn’t surprising for me as they are some of the most common Marvel Characters I knew growing up. The movies and shows with those characters also proved to me that they are the most popular Avengers from the original comic group. The frequency on the bar charts come from the ‘stories_available’ column in the dataframe.
avengers = ["Iron Man", "Thor", "Hank Pym", "Wasp", "Hulk", "Captain America", "Avengers"]
sns.barplot(data=df, x="name", y="stories_available",
order=avengers, palette='Spectral').set_title("Frequency of Original Avengers Characters in Comics")
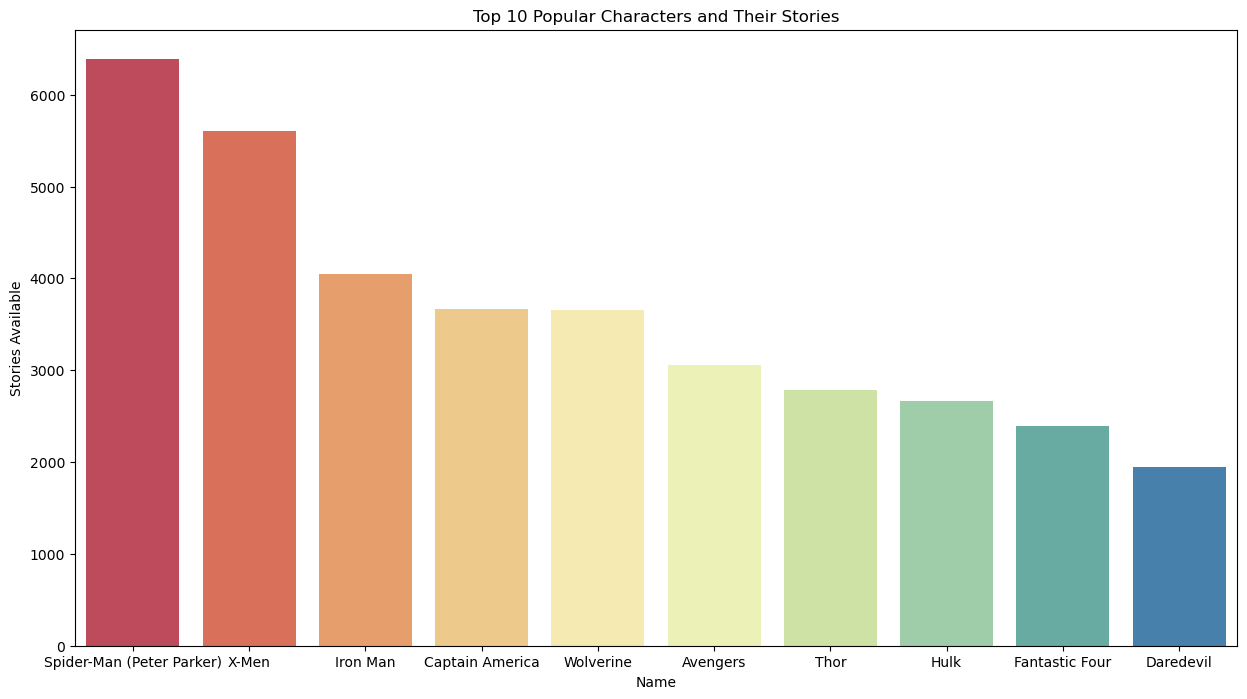
For the Top 10 Characters Story mentions, I needed to run a sort on the data. When the bar graph appeared, I wasn’t surprised by the results. There are many mentions in stories with all of those characters. I was familiar with all of them from Marvel and X-Men movies. I felt that this barchart described general popular knowledge of Marvel characters well. From my personal knowledge, Peter Parker as Spider-Man has had more movies and shows and comics (according to the data) than other superheroes. I have heard more debates over which actors played Peter Parker best than other characters. The Spider-Man movies are also some of my favorite superhero movies. His popularity in the comics wasn’t surprising to me. There was more I wanted to learn about Spider-Man’s presence in Marvel comics over time and how his various characters changed comic frequency.
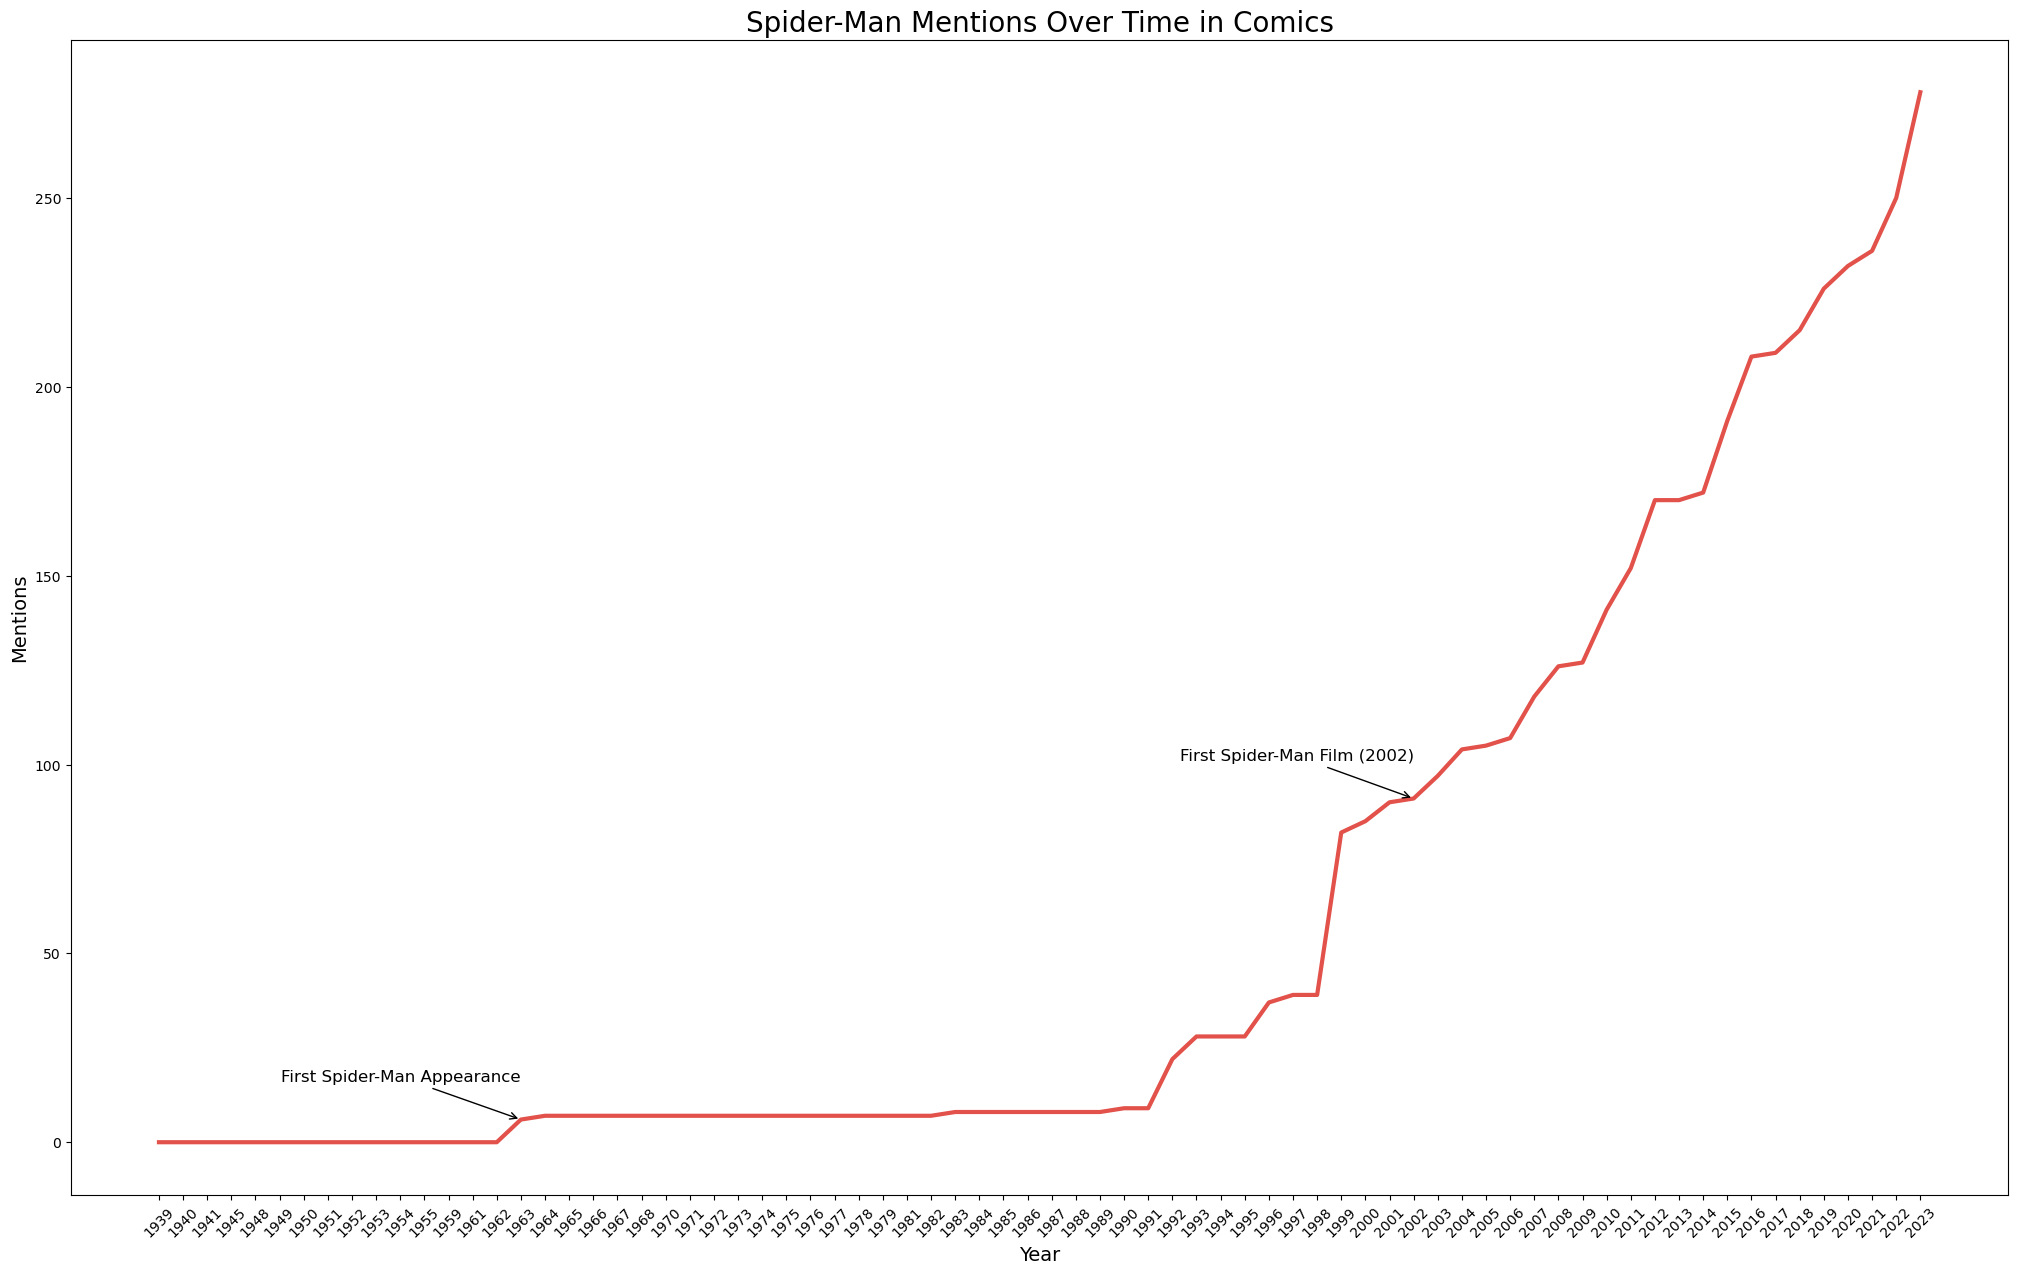
The Spider-Man character and the variations like Spider-Girl and Spider-Ham in the data carried its own interesting insights. Since the Peter Parker Spider-Man was dubbed the most popular Marvel character according to how many stories mention him, I wanted to see when his character appeared and how many comics he has appeared in over time. I wanted to see how his popularity has evolved over time. The resulting time plot was shocking but very interesting. I plotted the cumulative sum of the number of comics mentioning Spider-Man or variants. When the line flattens shows no increase in total mentions. This was a tricky plot to code, but Matplotlib did the job along with some basic library functions to prep the data.
#identify as many Spider-Man characters in the dataset
peter = years_df.loc[ ['Peter Parker','Spider-Man (Peter Parker)','Spider-Man (Miles Morales)', "Spider-Man (2099)", "Spider-Man (Noir)", "Spider-Man (1602)", "Spider-Man (Ultimate)", "Spider-Man (Ai Apaec)", "Spider-Man (House of M)", "Spider-Man (Ben Reilly)","Spider-Ham (Larval Earth)", "Spider-Girl (Anya Corazon)", "Spider-Woman (Jessica Drew)","Spider-Man (Marvel Zombies)","Spider-Man (Takuya Yamashiro)", "Spider-Woman (Mattie Franklin)", "Spider-Woman (Charlotte Witter)", "Spider-Man (LEGO Marvel Super Heroes)","Spider-Man (Marvel: Avengers Alliance)", "Ultimate Spider-Man (USM)"] ]
combined_spiderman = peter.sum(axis=0)
cumulative_sum = combined_spiderman.cumsum()
plt.plot(combined_spiderman.index, cumulative_sum.values, color = '#e2514a', linewidth=3)
As time continues there are more Spider-Man characters being written. The popularity surrounding this character seems to continue to increase. The only stagnant parts of Spider-Man’s comic book popularity is shortly after he came out as a character in 1963, from 1964 to 1982 and 1983 to 1989. After 1989 the number of Spider-Man comics or comics with the character has skyrocketed. It’s no wonder he is the most popular character.
As an additional part of my EDA, I wanted to see what numbers Peter Parker as Spider-Man had for mentions. Below shows what the code returned.
print(f"Marvel Character appearing in most stories and comics:\nName: {df_sorted['name'].iloc[0]}\nComics: {df_sorted['comics_available'].iloc[0]}\nStories: {df_sorted['stories_available'].iloc[0]}\nTotal Mentions: {top_10_characters['Spider-Man (Peter Parker)'].cumsum().iloc[-1]}")
Marvel Character appearing in most stories and comics:
Name: Spider-Man (Peter Parker)
Comics: 4405
Stories: 6388
Total Mentions: 19
#total mentions is used in the cumulative time plots
As I continued to explore my data, I wanted to see how comic book characters change over time. To accomplish this, I looked at the earliest year in my dataset and which characters were first written. I wanted to see if popular comic book characters has changed over time. Seeing what characters the writers started with would help to understand how the popularity of characters has changed over time. The resulting table is shown below:
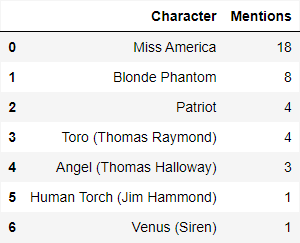
first_characters = years_df[years_df['1939'] != 0]['1939']
#make these characters into a table
results_df = pd.DataFrame({'Character': first_characters.index, 'Mentions': first_characters.values})
results_df = results_df.sort_values(by='Mentions', ascending=False).reset_index(drop=True)
I found it interesting that I didn’t recognize any of the characters written in 1939. Time has clearly changed character popularity.
I did the same analysis for the top current mentions of 2023 to better understand current popular characters, and below is that resulting table:
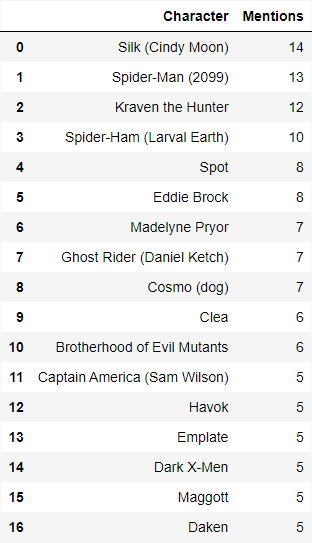
current_characters = years_df[years_df['2023'] > 4]['2023']
c_results_df = pd.DataFrame({'Character': current_characters.index, 'Mentions': current_characters.values})
c_results_df = c_results_df.sort_values(by='Mentions', ascending=False).reset_index(drop=True)
Since I am not a comic book reader, not all of the characters are familiar to me. However, Spider-Man is still getting new comic books, and new characters are still being introduced. None of the first Marvel characters are having comic books written about them anymore. The trends are changing over time, with some characters staying consistent in popularity.
Looking back to the original avengers, I wanted to see the trends in their popularity as individual characters and as a combined Avengers entity. Like I did with the Spider-Man data, I made plots of the avengers over time to see trends in when comic books were written about them.
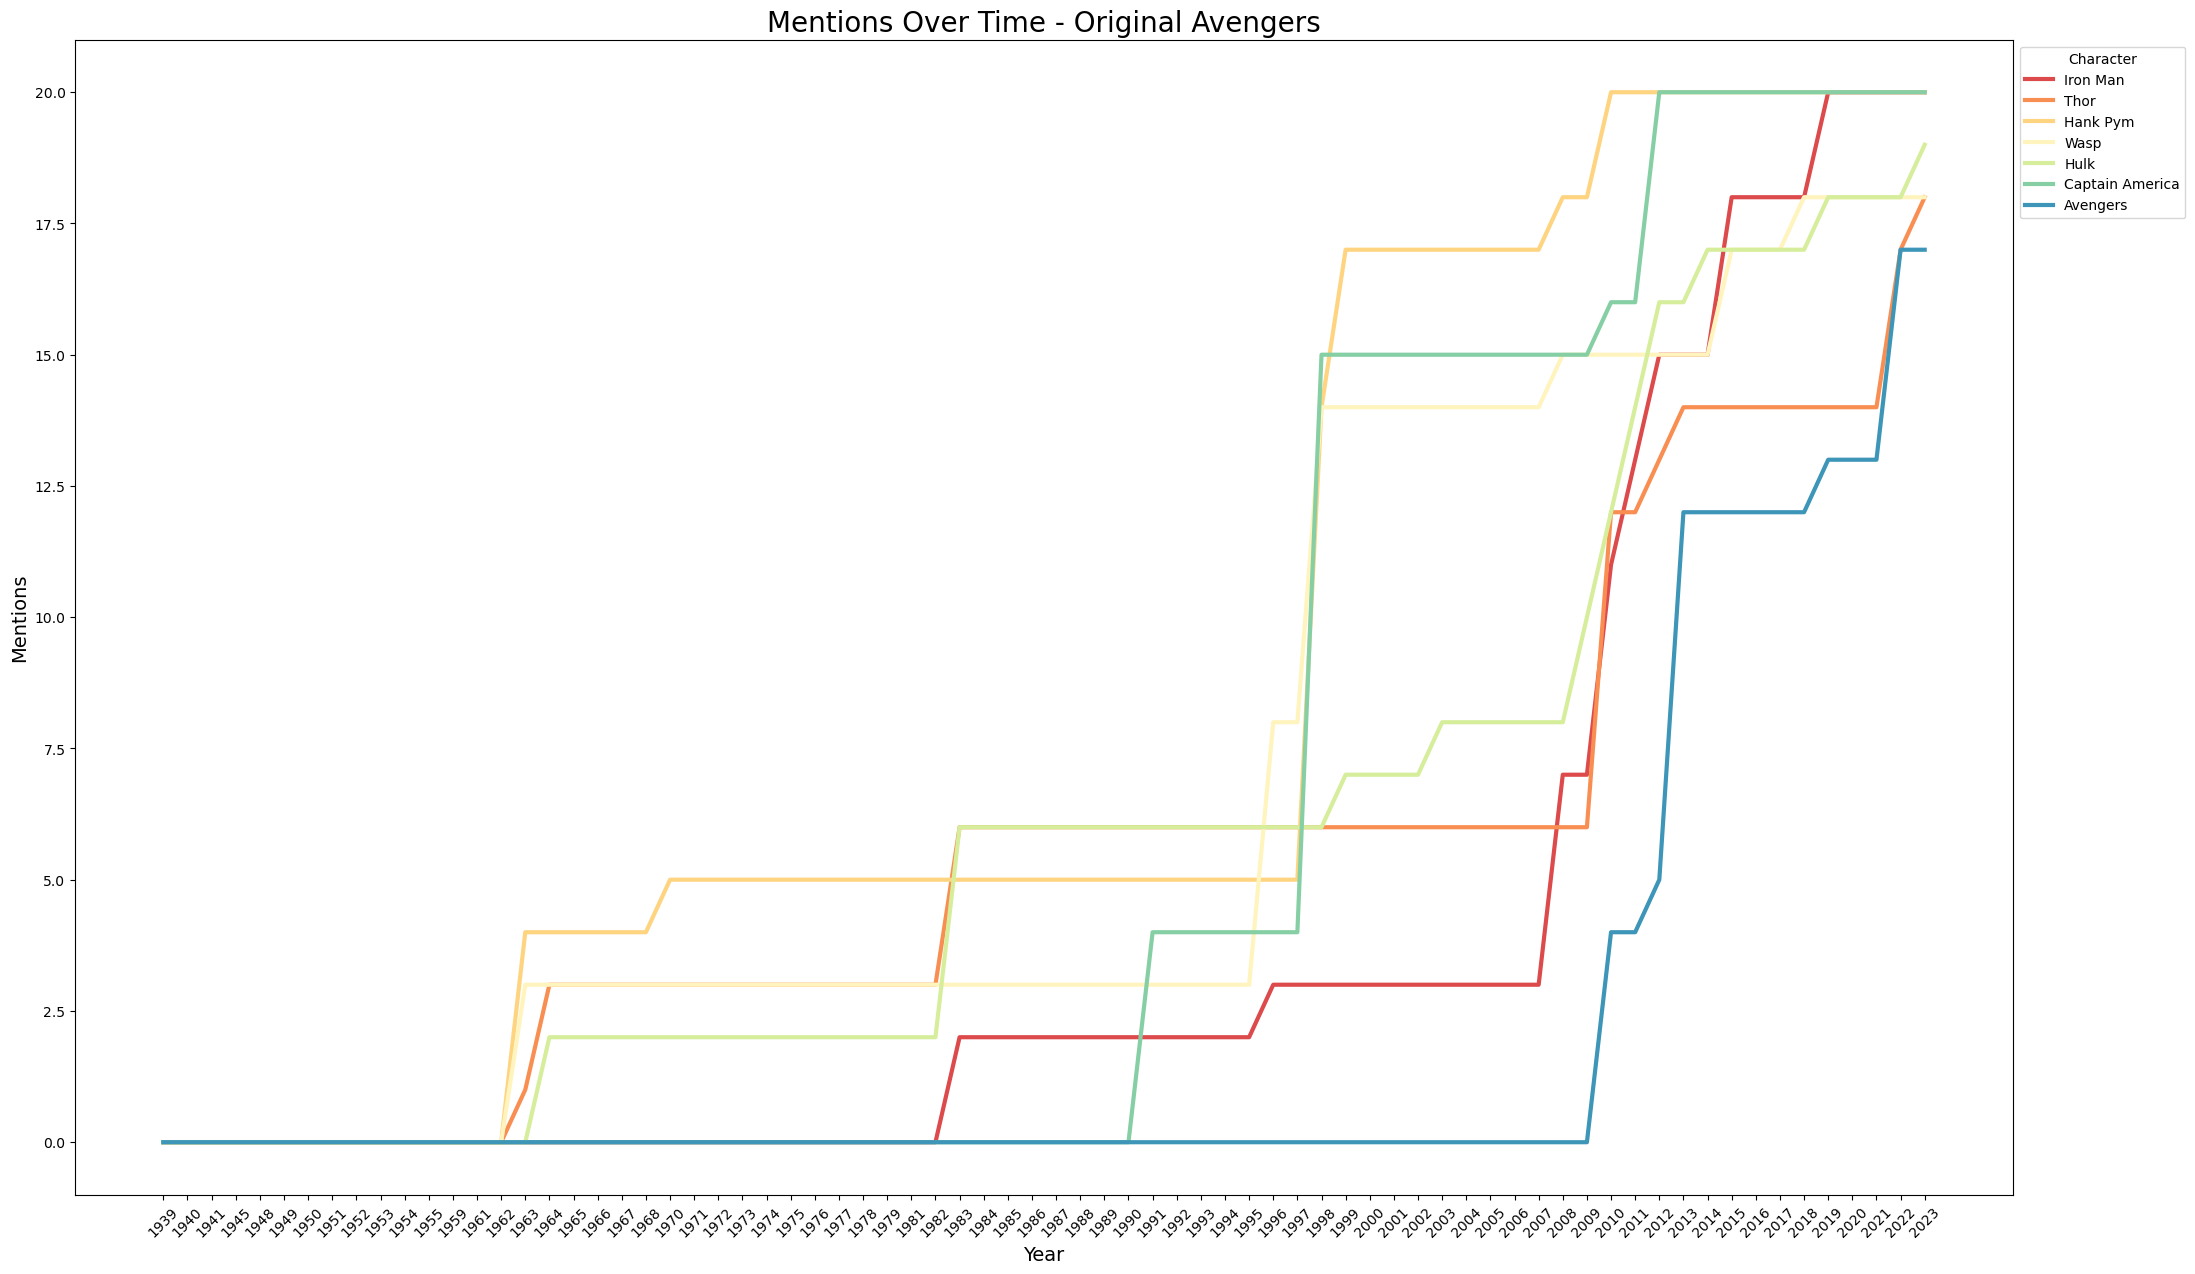
colors = sns.color_palette("Spectral", n_colors=len(top_10_characters.columns))
for character, color in zip(top_10_characters, colors):
    cumulative_sum = top_10_characters[character].cumsum()
    plt.plot(cumulative_sum.index, cumulative_sum.values, label=character, color=color, linewidth=3)
In this visualization, we can see the original avengers begin to emerge as characters in the early 1960s. With several points for each character showing no increase in mentions, there are periods of time where each character has not been as popular and had no new comics about them. The main increase in comic book popularity for these characters shows around the time when Marvel came out with movies for them and the general population was introduced to the superheroes.
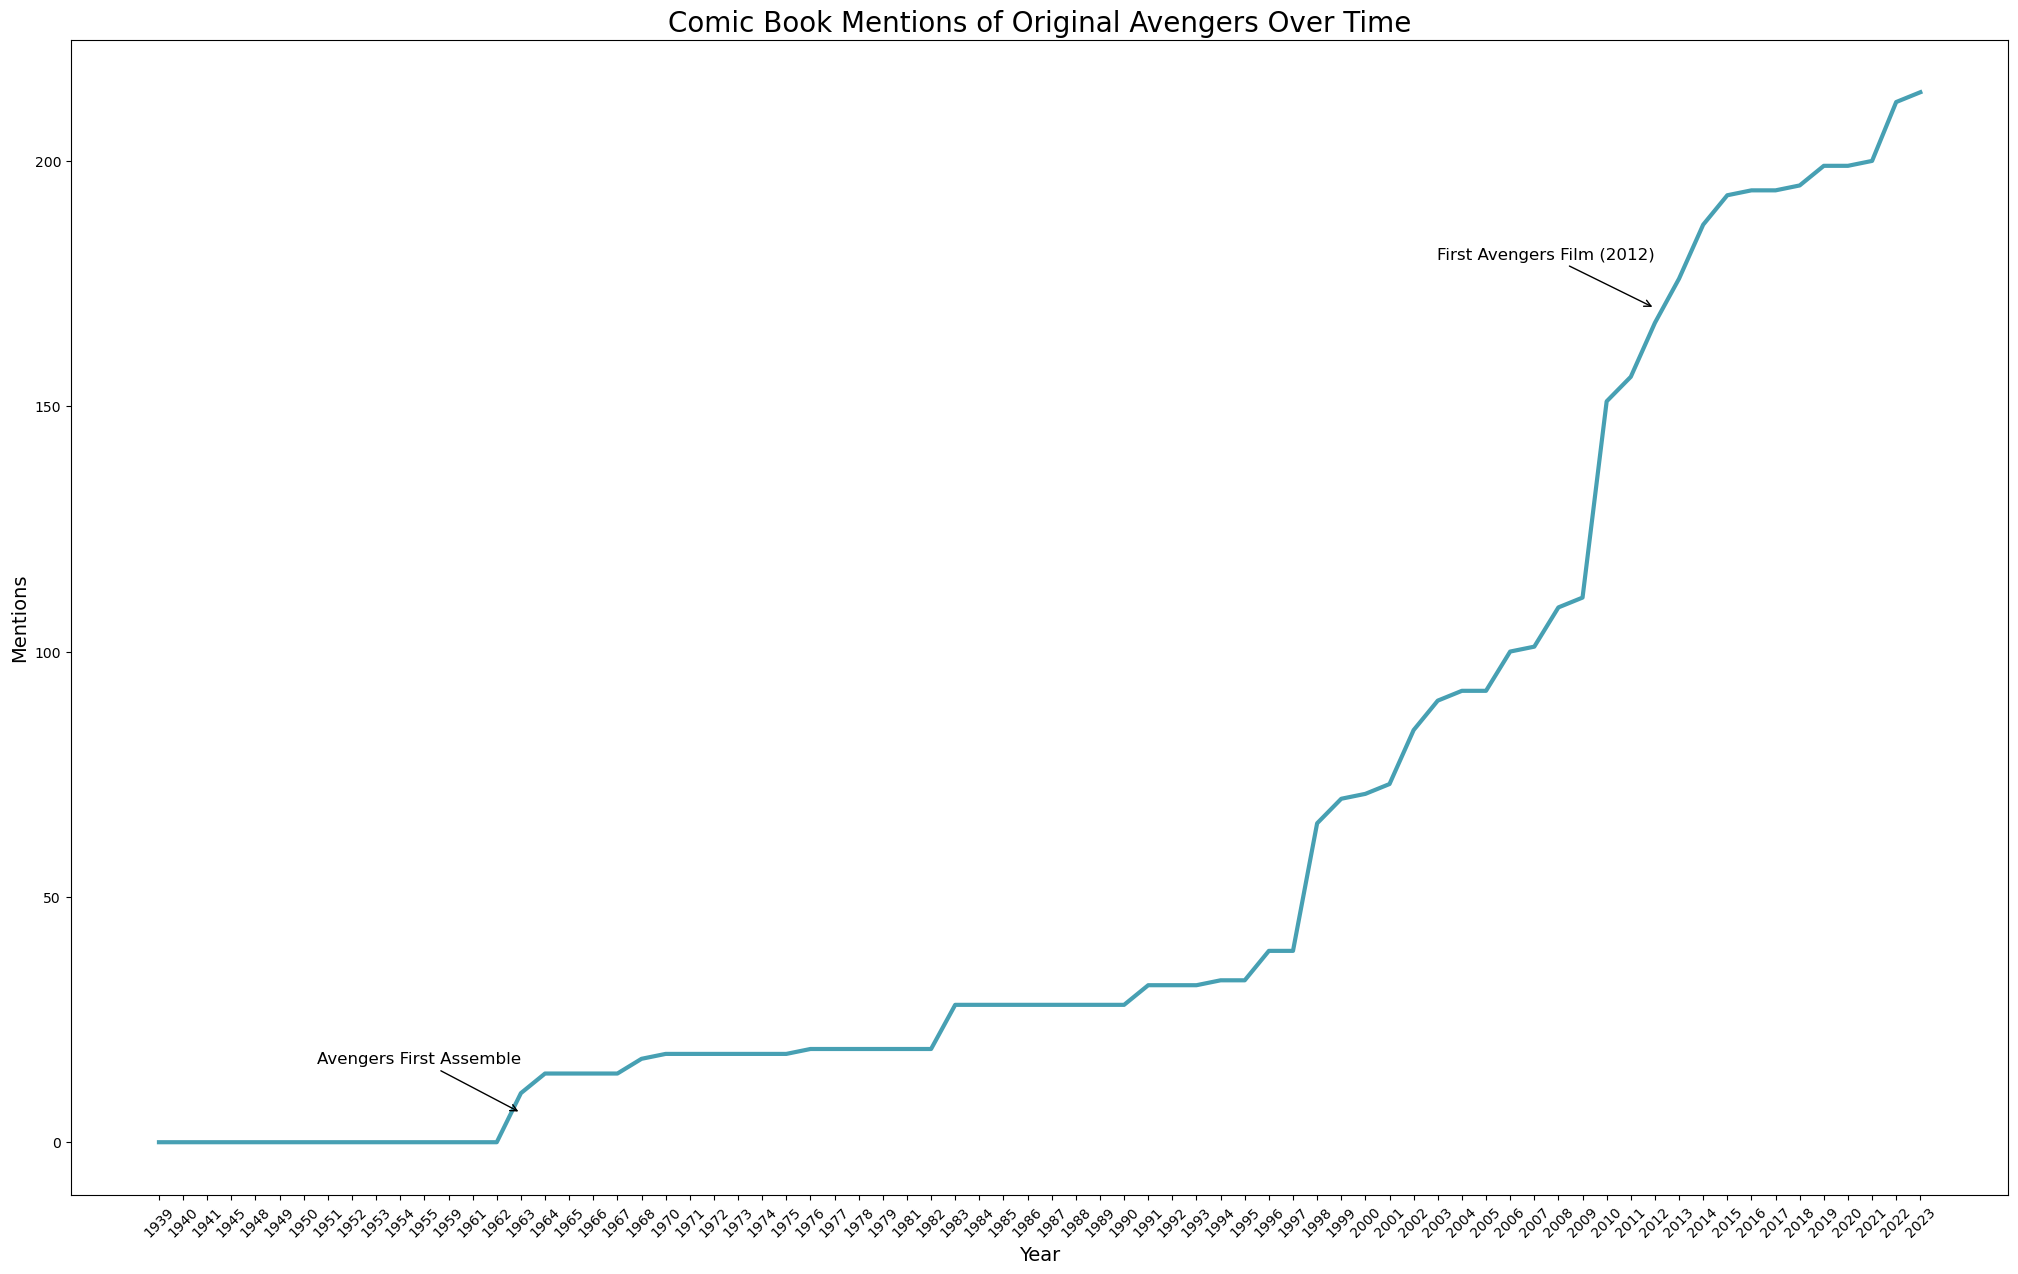
The next line plot uses the same data as before and includes other names for those original characters. Like Spider-Man’s plot, I used the combined character values and did a cumulative sum over time to show how general avenger trends have increased over time. The movies brought the sharpest increase of character popularity and has helped them continue to increase over time. I used the same code structure as the cumulative Spider-Man plot and included interesting points that show when popular culture would have picked up the popularity. An interesting point to note is that the comic book popularity for the Avengers didn’t significantly or sharply increase after the avengers movies began to come out, but they seemed to steadily increase.
Just as with the original Avengers, I looked at the top 10 characters and the comic book trends over time. There was more interesting variety with these characters. While all of the characters show a high total, there is variation in the popularity over time. The code was similar to the Avengers’ multi-line plot for reference.
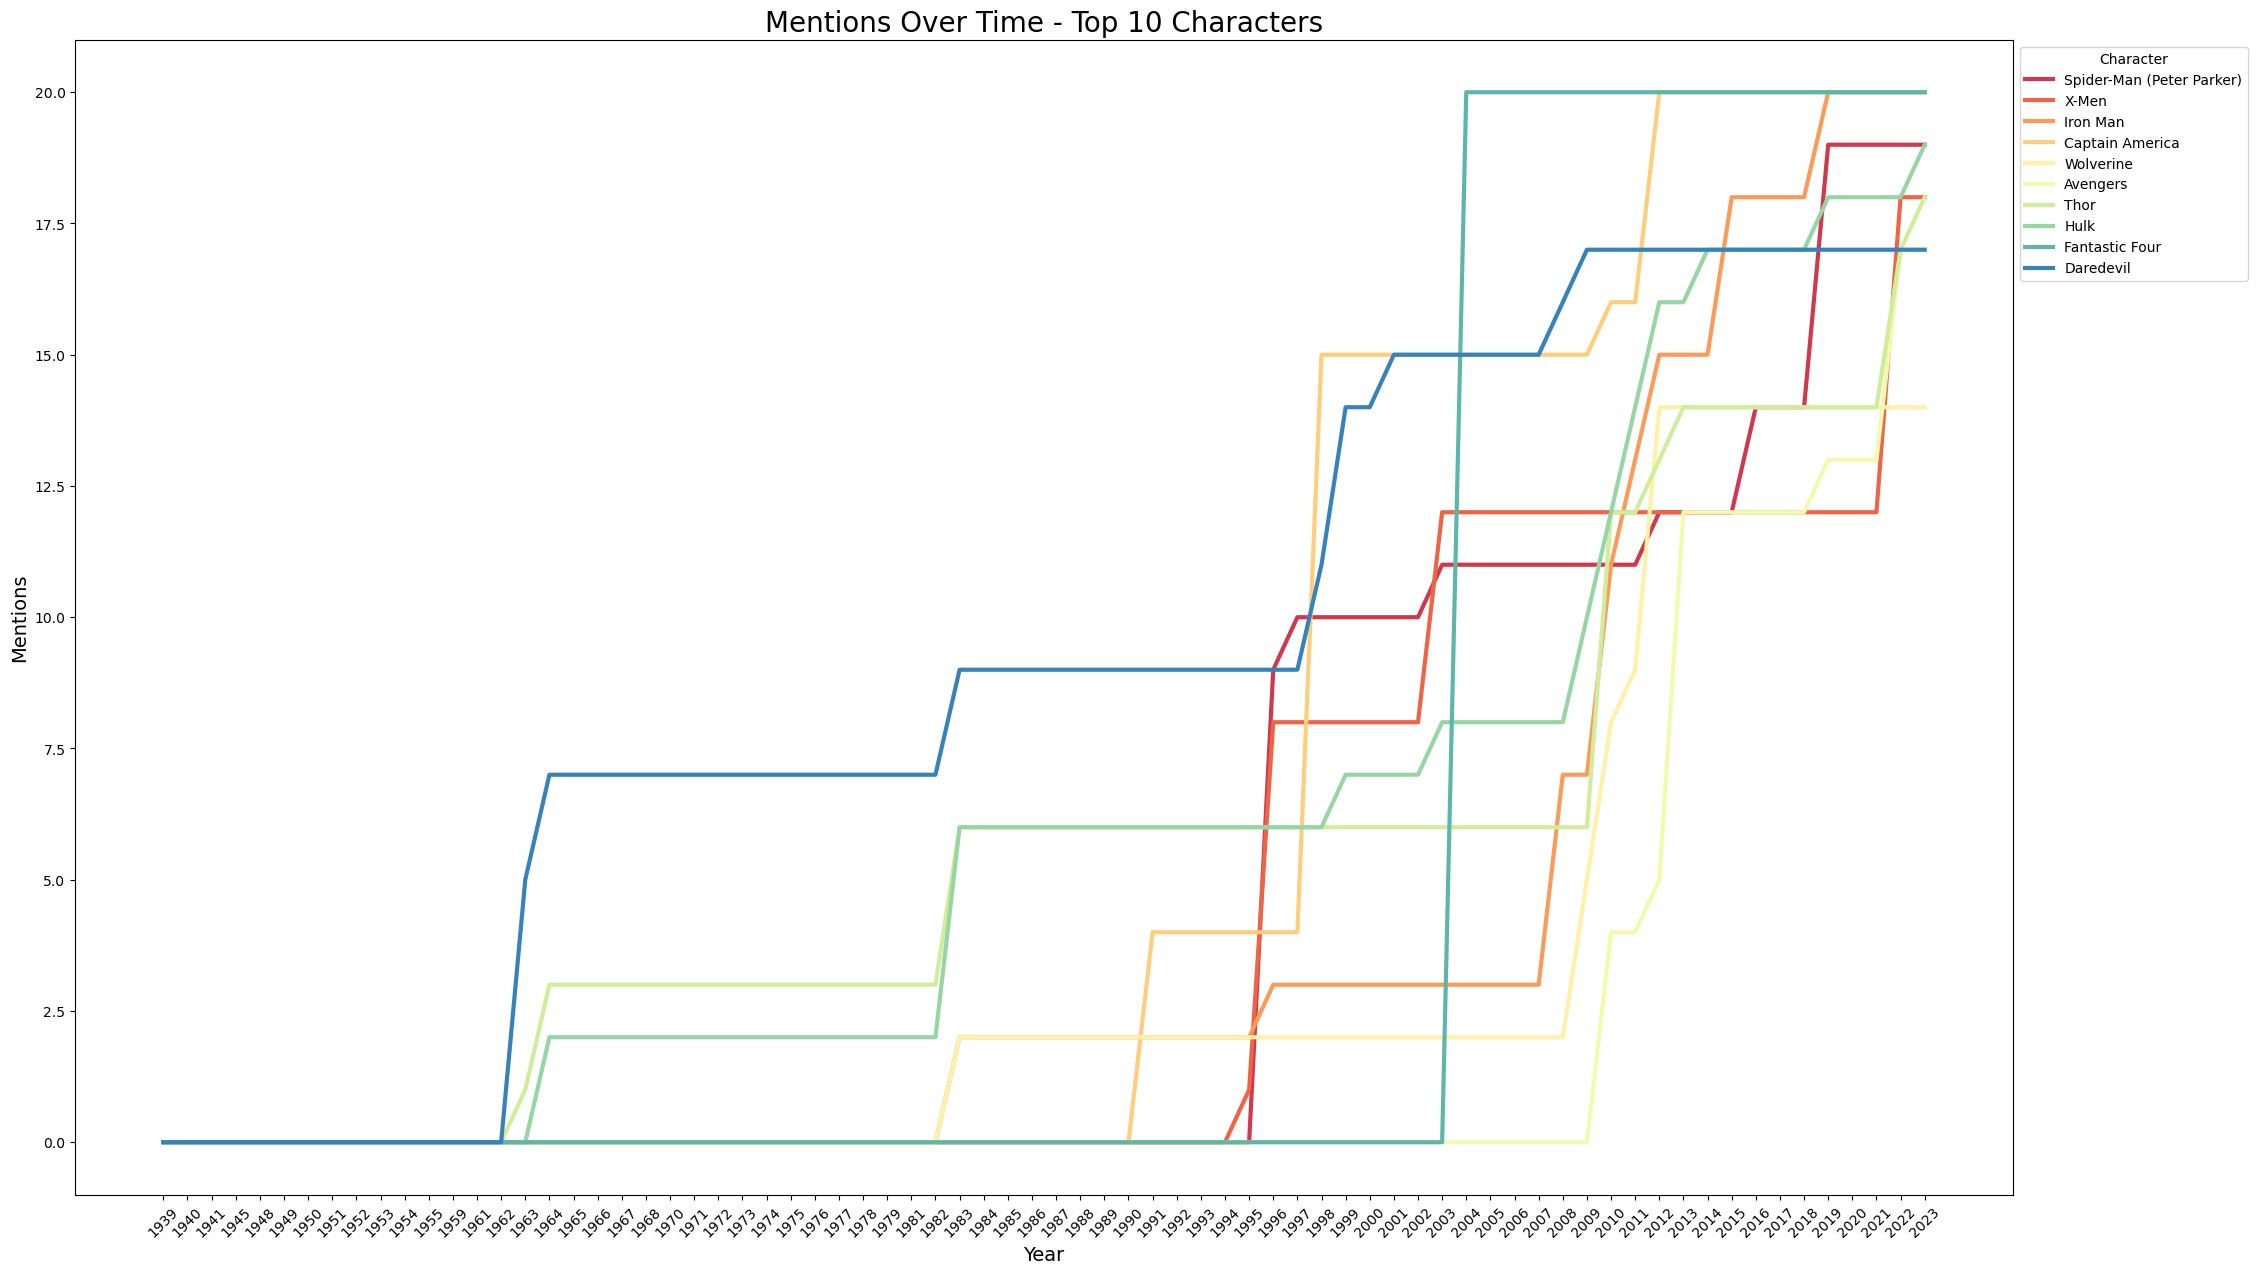
The last insight I hoped to gain was which years the top 10 popular characters peaked in popularity. The table below shows which year they have the most mentions and how many comic books they were mentioned in. There were several interesting insights here which I will go into in the next section. My code also wasn’t as neat as it could be since I hard coded removing certain rows that had repeat characters. While there are improvements in my code to be made, this is the best I could come up with and feel it worked well enough to answer my question.
max_mentions_top_10 = top_10_characters.idxmax(axis=1)
max_mentions_per_character = top_10_characters.max(axis=1)
result_df = pd.DataFrame({'Character': max_mentions_top_10.values, 'Year': max_mentions_top_10.index, 'Max_Mentions': max_mentions_per_character.values})
result_df = result_df[result_df['Max_Mentions'] > 1].reset_index(drop=True)
#remove row 0, 2, 5, 8, 10, 13, 14, 15 from the df
result_df = result_df.drop([1, 3, 6, 7, 10, 12, 15, 16, 17])
result_df = result_df.sort_values(by='Max_Mentions', ascending=False).reset_index(drop=True)
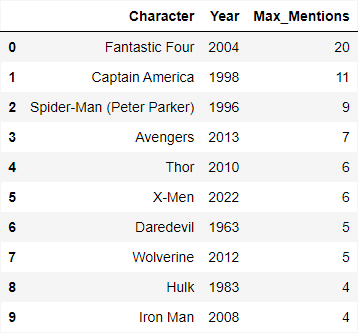
Top Insights Summary
- While Spider-Man was shown to be the most popular comic book character over time, it was interesting to see how the variety in who Spider-Man, Spider-Girl, Spider-Ham, etc. are has helped maintain that popularity in recent years.
- The original Marvel Universe characters are no longer mentioned in comic books.
- The Fantastic Four gained quick popularity in 2004 and got movies and many comic books, but haven’t made any comic book appearances since.
- Daredevil was at his most popular in 1963 and was so popular back then that he is in the top 10 most mentioned characters in the Marvel Universe.
- Marvel continues to develop new characters and superheroes, affecting the trends in popularity over time as older and less popular characters are phased out.
Conclusion
My EDA of the Marvel comic book character data was insightful. There were some things I didn’t know, such as how long certain characters have had comic books written about them, and things that I believed and were confirmed, like how Iron Man and Captain America are the most popular Avengers. Like most things in society, trends change over time, and Marvel isn’t exempt from those changes. There are lots of insights to gain about popularity of characters within the Marvel Universe and events surrounding them. This EDA was meant to dig into the characters over time and general popularity. There is more to be learned from the Marvel Character API. I feel like I have only scratched the surface, and can’t wait to see what insights future exploration will reveal.
To explore the data for yourself, check out my Streamlit App