Collecting Marvel Data For an EDA
An introduction to the EDA process of the Marvel API.
![]()
Introduction
Exploratory Data Analyses(EDA) are interesting and informative ways to gather and understand data. There are many different ways to collect data to explore, such as APIs, web scraping, and finding established datasets. I wanted to do an EDA on a topic interesting to me with lots of insights to be gained. After searching for interesting data I could use, I found an API from Marvel that piqued my interest. I am not a comic book reader, but I have enjoyed the Marvel Cinematic Universe for the most part. The Avengers saga is what really piqued my interest in the Marvel Universe. The stories and characters were engaging, and the progression of films was exciting to discuss and watch with friends and family. Looking through what the API offered gave me some initial questions I decided to explore.
“What are the trends in character popularity within the Marvel Universe, and how have these trends evolved over time?” “What insights can be gained regarding the changing popularity with different characters and events within the Marvel Universe?” “Who is the most popular character and how has that popularity changed over time?” “How does the Marvel Cinematic Universe affect character popularity in comics?”
With these questions in mind, I dove into my EDA.
Description
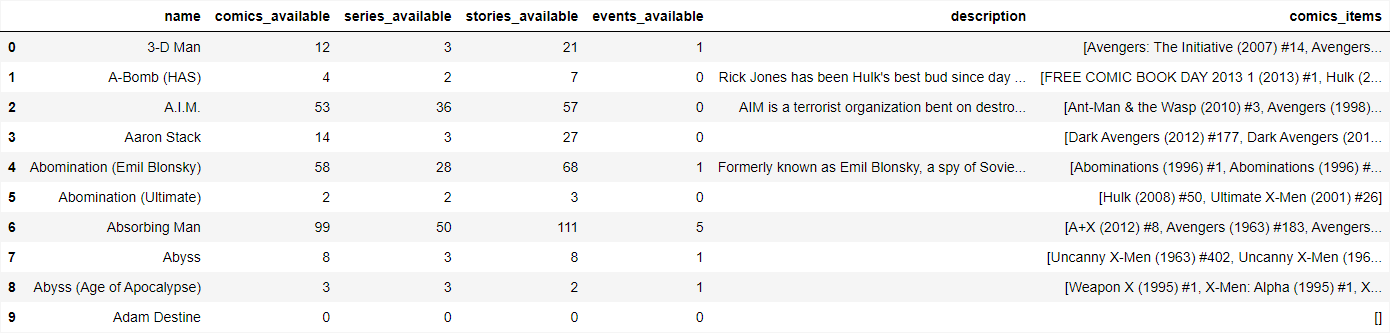
Before this EDA began, I was a beginner to web scraping and making API requests. It took some time and some helpful Google searches to write my requests code, but in the end, I was able to get an inital dataset. I drew from the Characters endpoint of the Marvel API. Since my questions were focused around Character popularity, this seemed like the best option. To clean my data, I kept the columns with information I felt would be useful in my EDA while discarding the others. I also had to figure out how to best access all the data in nested dictionaries. The last step for me was to make sure any NaN’s were changed to 0. This process created my first dataframe for my EDA. Below shows some of the code I wrote to collect and clean this data.
#previous code runs the API and saves to a json and csv file
with open('marvel.json') as f:
    data = json.load(f)

characters = []
for entry in data:
    character = {
        'name': entry['name'],
        # 'description': entry['description'],
        'comics_available': entry['comics']['available'],
        'series_available': entry['series']['available'],
        'stories_available': entry['stories']['available'],
        'events_available': entry['events']['available'] if 'events' in entry else None,
        'description': entry['description'] if 'description' in entry else None
    }

    character['comics_items'] = [item['name'] for item in entry['comics']['items']]
    character['series_items'] = [item['name'] for item in entry['series']['items']]
    character['stories_items'] = [item['name'] for item in entry['stories']['items']]

    if 'events' in entry:
        character['events_items'] = [item['name'] for item in entry['events']['items']]
    else:
        character['events_items'] = None

    characters.append(character)

df = pd.DataFrame(characters)
Below shows some of the output from this first dataframe.
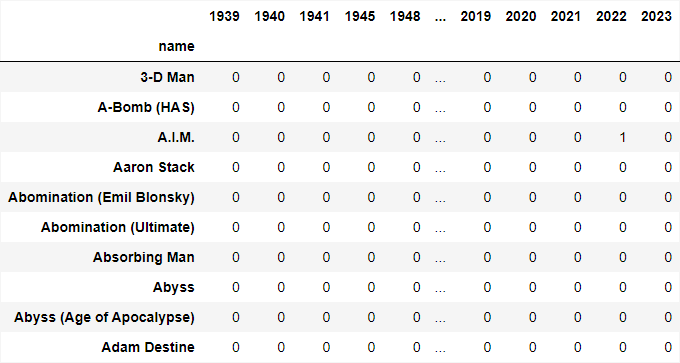
I made another dataframe that drew from a list within the first dataframe showing the titles and years of the comics. I extracted the years from each and made my new dataframe show the Character’s name followed by columns for each year Marvel has made comic books. If a character didn’t have a comic in a year, I made sure the dataframe showed 0 instead of NaN after cleaning. The year columns a character had comics in were made to be counts instead of the name of the comic. Below is some of the code I used to create this dataframe.
def extract_years(comics):
    comics = [str(comic) for comic in comics if isinstance(comic, str)]
    matches = [re.findall(r'\((\d{4})\)', comic) for comic in comics]
    years = [year for match in matches for year in match]
    return years

# df.apply(lambda row: update_years(row['comics_items']), axis=1)

#cleaning and combining the data
for character in df['name']:
    if character not in years_df.index:
        years_df.loc[character] = 0

character_counts = {character : Counter() for character in years_df.index}

for index, row in df.iterrows():
    years = extract_years(row['comics_items'])
    character_counts[row['name']].update(years)

for character, counts in character_counts.items():
    for year, count in counts.items():
        years_df.loc[character, year] = count
        #if a NaN
years_df = years_df.fillna(0).astype(int)
years_df = years_df.reindex(sorted(years_df.columns, key=lambda x: int(x) if x.isdigit() else float('inf')), axis=1)
# sum the mentions for each character
sums = years_df.sum(axis=1)
This process concluded creating my second dataframe. Below is some of the output for the years dataframe.
Explanation
Because of the nature of data collection, ethics needed to be taken into consideration. I checked the policy for Marvel’s API usage to make sure I wouldn’t violate any. I also made sure to take time and consider the purpose behind my EDA and that it was ethical. I made sure that the data I used would be protected through my API keys, which were included in my .gitignore file. I also wanted to make sure that the data I used would stay within the context in which it was meant for. No ethical lines were crossed during my EDA as it was taken into consideration throughout the process.
Conclusion
Finding, cleaning, and exploring the data collected in the Marvel API was an interesting process and a great learning experience. I was able to begin the process of answering my EDA questions and explore a topic I am interested in. Through coding and personal reflection, I was able to start assembling Avengers myself.
Code and Data Links
To see my data, click here: Marvel Data
To see how I analyzed my data, click here: Code Repository